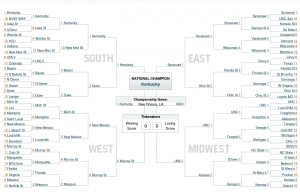
Hokay, So I had a lot of fun with this. Let me start by saying I’m not the first to do this. However, after a lot of Googling, I found surprisingly few NCAA Bracket predictions using the ELO system. Those that I did weren’t transparent about the data they used. I wanted to do it so I could see the result with data I knew, and as a good excuse to code some Ruby.
Overview
First, the ELO system. The ELO system is a way of calculating the relative skill between two players (and thus a probability for one to win in a future match). Wikipedia has an excellent write-up including the history and the math behind the scoring. In a nutshell, it calculates an expected result based on the rankings of the two teams. It then compares the actual result to the expected one, and adjusts each player’s rank accordingly (increasing it for the winner, subtracting for the looser). If a favored team wins, the adjustment is small. If an underdog wins, the adjustment is larger.
Assumptions
Your conclusion is only as good as your assumptions, and we’ll we need to make a few. Most of the work is done by choosing the ELO system, it’s one of the simpler systems for relative rankings. For our data, we’re only interested in what two teams played, and which team won. We ignore the final score, whether traveling or home, players used, fouls, timeouts, point distribution, etc. Also, for the purposes of this calculation, if the game went into overtime, I count it as a tie. That’s probably the most debatable assumption, but I feel it’s valid because it essentially means after an hour, the two teams displayed equal skill.
Data
So this turned out to be the hardest part. I wanted to use the 2011-2012 season as my dataset. After a half-hour of Googling, I couldn’t find the data in a well-structured format (read: csv or xls). So I had to resort to web scraping.
The best website I could find was the official NCAA site. They have a page with the Men’s Division 1 listing by team, where you can click into each team, to see a game history (amongst other things). Let’s grab it.
wget --mirror "http://stats.ncaa.org/team/
             inst_team_list?sport_code=MBB&division=1"
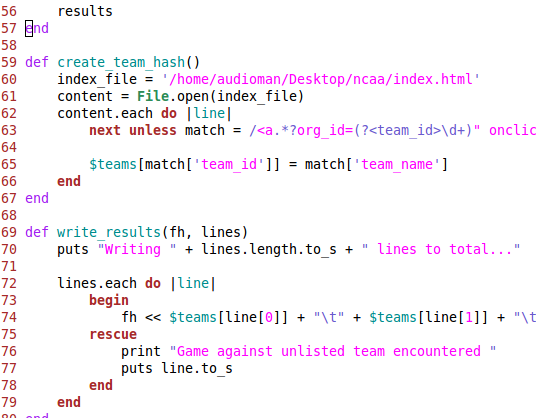
Well that was fun. wget was a little overzealous, so I moved all the relevent pages (those starting with 10740) into their own folder. I then wrote a Ruby script to organize the data, clean it up, and write it to a file.
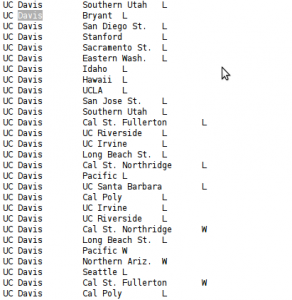
The output from that script is a beautifully structured file, if I do say so myself. Well, at least from a data perspective.
Number Crunching
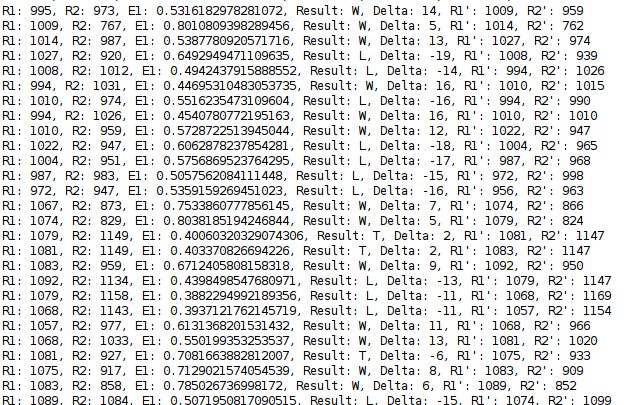
Okay, so now it’s time to actually calculate the elos. I basically wrote a straight implementation of the math as presented on Wikipedida. The second ruby script, reads in the scores, calculates the adjustments, and keeps track of the changes.
Here the output while it’s running:
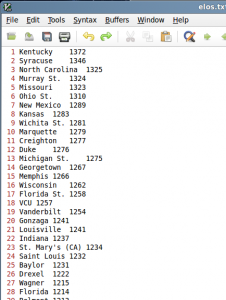
lastly, it sorts the results and writes them to a file.
Conclusions
We can see that the comparing our generated results to the seeded rankings, there’s a lot of overlap. The top three teams are predicted exactly as seeded. However, from there the list diverges quite a bit. For example, Murray St. is expected to take the west, but didn’t get seeded so hot.
So, if this wins, I’ll get some money from our office bracket pool. Which is nice. And if it doesn’t, it will be proof that my computer messed up on the calculation.
—–EDIT——
My initial calculations didn’t account for the order in which the games were played. Although I didn’t think this would have a big influence, running the script on a computer that lists the data files in a different order actually made some big differences. Thus, I changed the data scraping script to account for the dates, and calculate all ELO scores in the order that they were played. This should result in a more accurate, and reproducable result. Here is the updated script, and the updated final result. Here’s my Final Bracket.
